Predictors of Mobile App Success
We’re often asked by merchants whether a mobile app would be good for their business. One of the top predictors is whether they have a strong base of repeat customers. Mattress firms are probably not a good example of a product category, whereas hot apparel companies would be great candidates.
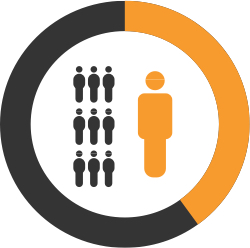
Many merchants we speak with are struggling to understand the rapidly evolving mobile commerce trends and do not know the size and shop/purchase frequency for their top customers. For this reason, the graphic shown here is a useful metric to use. An Adobe study across retail channels found that 8% of customers make up 41% of sales for a typical merchant. The graphic rounds off these numbers to 10% / 40%, to make it more memorable and to connect it to the familiar “80/20” rule.

For most retailers, the average customer who buys once or twice a year is probably not going to download their app — unless there’s more than shopping involved here, which is the subject of an upcoming post. Instead, the app should focus on the top 10% of customers who are frequent shoppers, who generate the most sales and who – if you can move the needle – can generate the greatest ROI.
Does your company have a strong base of repeat customers?
Or are you interested in building a strategy to deliver elite service to your special customers?
If so, we’d be glad to help you assess what an app could do for your business.
